SPX Monitoring purposes; Short SPX on 9/1/23 at 4515.77; cover short 9/5/23 at 4496.83 = gain .43%.
Gain Since 12/20/22: 15.93%.
Monitoring Purposes GOLD: Long GDX on 10/9/20 at 40.78. Chart 1
This week is the weakest week of the year, according to seasonality.
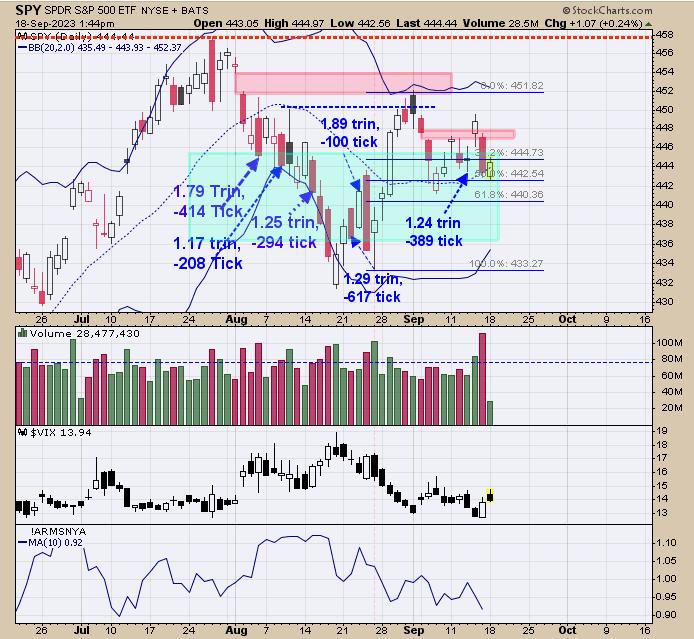
The top window above is the SPY. We labeled the times in blue when the TRIN and TICK closed in panic levels. Panic only appears at bottoms in the market; no panic readings, no bottom. Panic also occurs near the same price levels. We shaded in light blue when panic TRIN and TICK closes occurred, and that appeared between the 435 to 445 SPY ranges. Its appears the SPY is building a base from 435 to 445 SPY range for another rally to begin from. The SPY may test the lower range of this level one more time before the next impulse wave up begins.
The chart looks at the bigger picture. The second window up from the bottom is the 10-day average of the TRIN closes. It’s common for the market to stall, if not decline, when the 10-day TRIN reaches .90 and lower. We marked the times with red lines the times when the 10 day TRIN reached .90 and lower. Currently, the 10-day TRIN stands at .92, which leans bearish. A 10-day TRIN above 1.20 is normally found near lows in the market, and is something that may appear in the coming weeks when the next major low is approached. We are expecting a year-end rally, and that may come when the 10-day TRIN reaches above 1.20.
Tim Ord,
Editor
www.ord-oracle.com. Book release “The Secret Science of Price and Volume” by Timothy Ord, buy at www.Amazon.com.
Signals are provided as general information only and are not investment recommendations. You are responsible for your own investment decisions. Past performance does not guarantee future performance. Opinions are based on historical research and data believed reliable; there is no guarantee results will be profitable. Not responsible for errors or omissions. I may invest in the vehicles mentioned above.


