Advanced Micro Devices (AMD) slightly topped Wall Street’s earnings and guidance expectations on Tuesday, but, instead of rallying, its stock tumbled 7%. AMD was at its 61.8% Fibonacci retracement level, which, for many traders, can present an ideal “buy low” opportunity or a “get-ready-to-exit” threshold for those who bought the stock near the bottom of the uptrend.
AMD’s decline brings several questions to the fore: Is AMD a buy or a sell? What technical or fundamental factors might drive this decision? What are the key levels to watch?
The Fundamental Picture
AMD’s EPS (61 cents) and revenue ($5.47 billion) barely edged above analyst consensus; they were practically in line with what Wall Street expected. The company’s current quarter estimates also matched analyst forecasts. It’s nothing bad, but nothing great, either.
The immense potential growth driver, however, is AMD’s forecasted sales of AI chips—around $4 billion this year. Still, the stock came tumbling down. So, if AMD’s plunge was the market’s way of correcting an overvaluation, then is the company’s AI chip forecast already baked into the current price level?
Analyst price targets are mixed. But before that, let’s look at the technical picture.
AMD and the AI Revolution
Viewing AMD stock on a weekly chart, you can see it has been trending downward since hitting an all-time high of $227.30 in March.
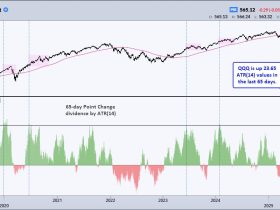
CHART 1. CHART OF AMD STOCK. AMD’s relative performance against NVIDIA, the leader in AI chips, begins sinking after November 2022. AMD is also trailing the semiconductor industry. Chart source: StockCharts.com. For educational purposes.
Returning to the second week of November 2022 (see vertical blue line), you can see AMD’s slow but steady climb relative to the larger Tech sector (XLK). That line marks the onset of the current AI trend, sparked by OpenAI’s public launch of ChatGPT. This budding AI “revolution” has thrust chipmakers like AMD into the limelight, positioning the industry as a fertile ground for expansion and a fiercely competitive arena for semiconductor companies.
So, while AMD is still outperforming the general Tech sector by 21%, it’s trailing the larger semiconductor industry ($DJUSSC) by -25.85% and NVIDIA, the world’s leading AI chipmaker, by a whopping 70%.
AMD missed the AI boat and fell drastically behind. However, according to its forecasts, AMD’s prospects of catching up are rapidly improving. So, is this what’s driving indecision at the current levels?
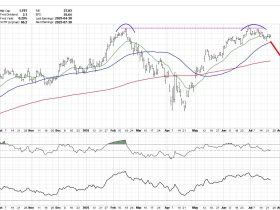
In AMD’s daily chart (see below), the stock is trading at the 61.8% Fib retracement level. This is a make-or-break level for traders: for those looking to go long, it represents a deep pullback (a break below this level increases the prospect’s bearishness). It also represents the lowest level to exit a long trade for those who got in toward the bottom of the latest uptrend.
CHART 2. DAILY CHART OF AMD. The stock is at a critical juncture, and its next move can trigger either a strong buy or sell signal, depending on the outcome and the underlying momentum.Chart source: StockCharts.com. For educational purposes.
The Money Flow Index (MFI) is trending upward, creating a bullish divergence between price and the buying pressure it represents. The Chaikin Money Flow (CMF) indicates stronger selling pressure. If you plan on going long, you want to see both indicators trending in the same direction.
3 Levels to Watch
The 61.8% Fib retracement line: A close below this level would invalidate and possibly reverse the longer-term uptrend.The $133 price range: The low of 2024 and high of 2023 may serve as the next level of support.The $124 price range: A cluster of resistance and consolidation levels in 2023, this range may serve as an even lower area of support; however, a break below can signal further downside risk.
What Are Analysts’ Price Targets?
Analyst price targets for 2024 are fairly wide:
The highest price target is between $265 and $270.The median price target sits between $185 and $190.The lowest price targets range between $120 and $140.
This suggests that the current price is near the bottom of the target range and well below the average to high consensus.
The Takeaway
With AMD’s earnings and guidance satisfactory, its stock sits at a critical juncture. Technically, AMD is at an optimal buy level, but momentum doesn’t seem to favor the bulls. Meanwhile, it’s uncertain whether AMD’s AI chip prospects are baked-in or underestimated. While you won’t be able to predict the outcome of AMD’s AI performance in the near term, you can see the technicals levels that might trigger a bounce or a bust. Momentum and price action are critical, so watch them closely in the next few days.
Disclaimer: This blog is for educational purposes only and should not be construed as financial advice. The ideas and strategies should never be used without first assessing your own personal and financial situation, or without consulting a financial professional.


