I’ve been looking for the market to bottom for several weeks. But the trading environment has shifted to a new gear; a cautionary one. On the other hand, this sudden shift in sentiment may signal that a climactic selloff, often a prelude to a new uptrend, may be close at hand. Fingers crossed.
Markets correct in two ways: via falling prices or through time via lengthy and painful consolidations. The current market had been in a time correction until last week when the bearish interest environment and the rising hostilities in the Middle East pushed bullish and neutral traders over to the bearish side.
You can see this happening in the market’s breadth (more on that below), and in the dearth of sectors that are in uptrends. An even more cautionary sign is the Cboe Volatility Index ($VIX) crossing above 20, a sign that bearish sentiment is rising to new levels.
As a result, it makes sense to focus on cash, build a shopping list, and look well off the beaten path for stocks in areas of the market that may still provide some upside even as interest rates choke off much of everything else.
Subscribers to Joe Duarte in the Money Options have been well positioned for this market via these five time-tested steps:
Raising cash via positions that hit sell stops;Hedging of portfolios;Keeping position size small;Looking for relative strength in offbeat areas of the market andBuild a shopping list for when conditions improve.
Energy Has the Momentum, For Now
The energy sector remains a bright light in an otherwise dimming market. This is especially evident in large-cap oil, oil exploration and production, and natural gas stocks.
The two representative ETFs that illustrate this point best are the iShares Oil & Gas Exploration & Production ETF (IEO) and the First Trust Natural Gas ETF (FCG).
Both price charts are intuitively bullish, given their current uptrends, their trading near their recent highs, and the bullish rise in both Accumulation/Distribution (ADI) and On Balance Volume (OBV). Moreover, seasonal tendencies, as winter approaches and the rapidly evolving developments in the Middle East support higher prices in crude oil. In addition, disruptions in the oil supply resulting from the Israel-Palestinian conflict could lead to more money moving into natural gas companies as the liquified natural gas (LNG) market heats up again.
On the other hand, if these strong sectors roll over, it would signal that a full-blown market correction is unfolding.
I recently posted two new energy stock trades at JoeDuarteintheMoneyOptions.com. Have a look with a Free Trial here.
Off The Radar Interesting Stuff
Sometimes, it pays to look well beyond the mainstream, especially during geopolitical stress. Global commerce isn’t going anywhere despite the macro trend of relocating factories and supply chains to friendly neighbors (friend-shoring/near-shoring). That’s because some universal commodities are grown in specific parts of the world and not others—think coffee, cocoa, and yes, oil and natural gas.
That brings the global shipping industry to the forefront. The mainstream view, which leaders in the shipping industry support, is that times are about to get worse for the sector. Many in the industry are forecasting a global recession as they moan about falling contract rates and rising costs.
Yet a look at the SonicShares Global Shipping ETF (BOAT) shows that investors have been putting money to work in the sector. Granted, it’s a niche play and a small ETF with only $20 million in assets while trading in very low volumes. Moreover, it’s important to note that the stocks in this ETF are not household words and that sellers may gain the upper hand if the market climate fully sours.
For example, the ETF’s biggest holding is Japanese shipper Kawasaki Kisen Kaisha Ltd, which is not US traded. The only US-based company in its top holdings is Honolulu-based Matson Inc. (MATX), whose shares have had a decent run over the last few months and have recently entered a consolidation pattern.
Certainly, even as its stock has done well, MATX is not without risk as the company provides shipping and logistics along the Trans-Pacific sector and services to Hawaii, Alaska, and Guam. The most recent earnings report beat expectations but also sounded a cautionary note, focusing on the economic risks of an economic downturn in the U.S. and other potential problems involving the Chinese economy.
The flip side is that shipping costs will rise if a protracted war further disrupts the global supply chains and that companies like Matson will have pricing power.
My point in highlighting BOAT and Matson is not to recommend their shares but to illustrate the lengths investors may have to go to, especially the allowances to risk that may be required to uncover sectors and companies which may be worth considering in the current times.
Join the smart money at JoeDuarteintheMoneyOptions.com. You can look at my latest recommendations FREE with a two week trial subscription.
And for frequent updates on real estate and housing, click here.
Incidentally, if you’re looking for the perfect price chart set up, check out my latest YD5 video, where I detail one of my favorite bullish setups. This video will prepare you for the next phase in the market.
Market Breadth and Broader Indexes Test Major Support as Oversold Levels Near; VIX Breaks Above 20
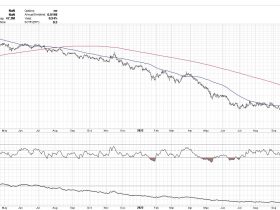
The NYSE Advance Decline line (NYAD) has struggled to climb above its 200-day moving average while remaining above its March and May bottoms. Unfortunately, looks as if we’re heading for a test of the March lows as the May support level has given way. A break below the March and May bottoms, as highlighted by the trend lines on the chart, would be doubly bearish. On the other hand, any further weakness in NYAD would lead to an oversold reading in the RSI (circled area), which could be the final washout of this correction.
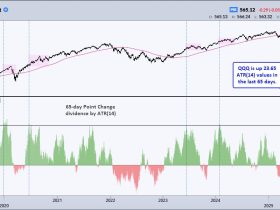
The Nasdaq 100 Index (NDX) broke below its 50-day moving average decisively and is testing the bottom of a major VBP support level (marked by the trend line). ADI and OBV both turned lower as selling pressure built. Again, as with SPX below, RSI is nearly oversold.
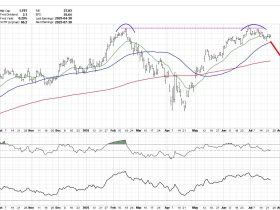
The S&P 500 (SPX) fell below its 200-day moving average and entered an important support level of 4150 and 4250 (highlighted by trend lines based on VBP bars). ADI and OBV turned lower, signaling rising selling pressure.
VIX Crosses Above 20, Signaling Rising Fear
The VIX has finally crossed above the important 20 level, which has kept the bears in check up to now. If this is not reversed, it will likely cause more trouble in the next few days to weeks.
When the VIX rises, stocks tend to fall as its rise signifies that traders are buying large volumes of put options. Rising put option volume from fearful traders leads market makers to sell stock index futures to hedge their put sales to the public. A fall in VIX is bullish as it means less put option buying, and it eventually leads to call buying, which causes market makers to hedge by buying stock index futures, raising the odds of higher stock prices.
To get the latest information on options trading, check out Options Trading for Dummies, now in its 4th Edition—Get Your Copy Now! Now also available in Audible audiobook format!
#1 New Release on Options Trading!
Good news! I’ve made my NYAD-Complexity – Chaos chart (featured on my YD5 videos) and a few other favorites public. You can find them here.
Joe Duarte
In The Money Options
Joe Duarte is a former money manager, an active trader, and a widely recognized independent stock market analyst since 1987. He is author of eight investment books, including the best-selling Trading Options for Dummies, rated a TOP Options Book for 2018 by Benzinga.com and now in its third edition, plus The Everything Investing in Your 20s and 30s Book and six other trading books.
The Everything Investing in Your 20s and 30s Book is available at Amazon and Barnes and Noble. It has also been recommended as a Washington Post Color of Money Book of the Month.
To receive Joe’s exclusive stock, option and ETF recommendations, in your mailbox every week visit https://joeduarteinthemoneyoptions.com/secure/order_email.asp.


