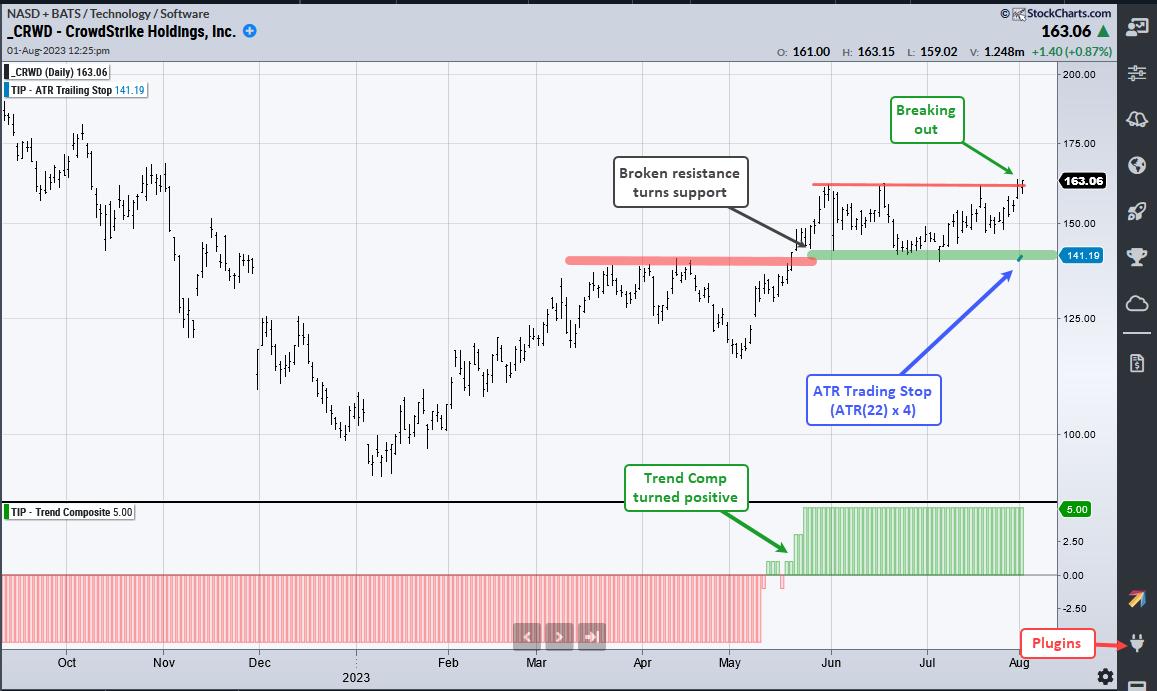
CrowdStrike (CRWD) is separating itself from the rest of the pack with a breakout and nine month high.
The chart below shows CRWD with an uptrend working throughout 2023. The stock bottomed in January, advanced to the 140 area and hit resistance here in March-April (thick red line). The stock then broke above this resistance level in May and broken resistance turned into support (green line).
This is a classic tenet of technical analysis: broken resistance turns into the first support level after the breakout. Also notice that the Trend Composite in the lower window turned positive in mid May and is at 5. This means all five indicators in the Trend Composite are bullish. Note that this indicator and ten others are part of the TIP indicator edge plugin for StockCharts ACP.
Shorter term, CrowdStrike consolidated with support in the low 140s and resistance in the low 160s the last two months. The stock is making a breakout bid here in early August and this signals a continuation of the larger uptrend. The summer lows mark key support at 140.
Chartists can also consider using the ATR Trailing Stop (short blue line). This is the highest close since the start date (31-July) less four ATR(22) values. 4 is the ATR multiplier (ATR(22) x 4). I chose this value (4) so the stop would start at the summer lows (support). This stop will rise if prices continue to rise.
TrendInvestorPro is currently running two quantified strategies. First, we have a momentum-rotation strategy trading S&P 500 and Nasdaq 100 stocks. Second, we have a short-term mean-reversion strategy trading Russell 1000 stocks. These strategies are outlined with detailed reports and performance metrics. Click here for immediate access.
The ATR Trailing Stop, Trend Composite, Momentum Composite and eight other indicators are part of the TrendInvestorPro Indicator Edge Plugin for StockCharts ACP. Click here to take your analysis process to the next level.
—————————————


