Over the past couple of weeks, the performance of the IT stocks has remained quite muted; the NIFTY IT Index has come off from its November highs and has consolidated over some time. This has led to relative underperformance of the IT group against the broader markets. However, a few signs have emerged on the chart showing this IT bellwether preparing for some upward price revision over the coming days.
Tata Consultancy Services – TCS.IN
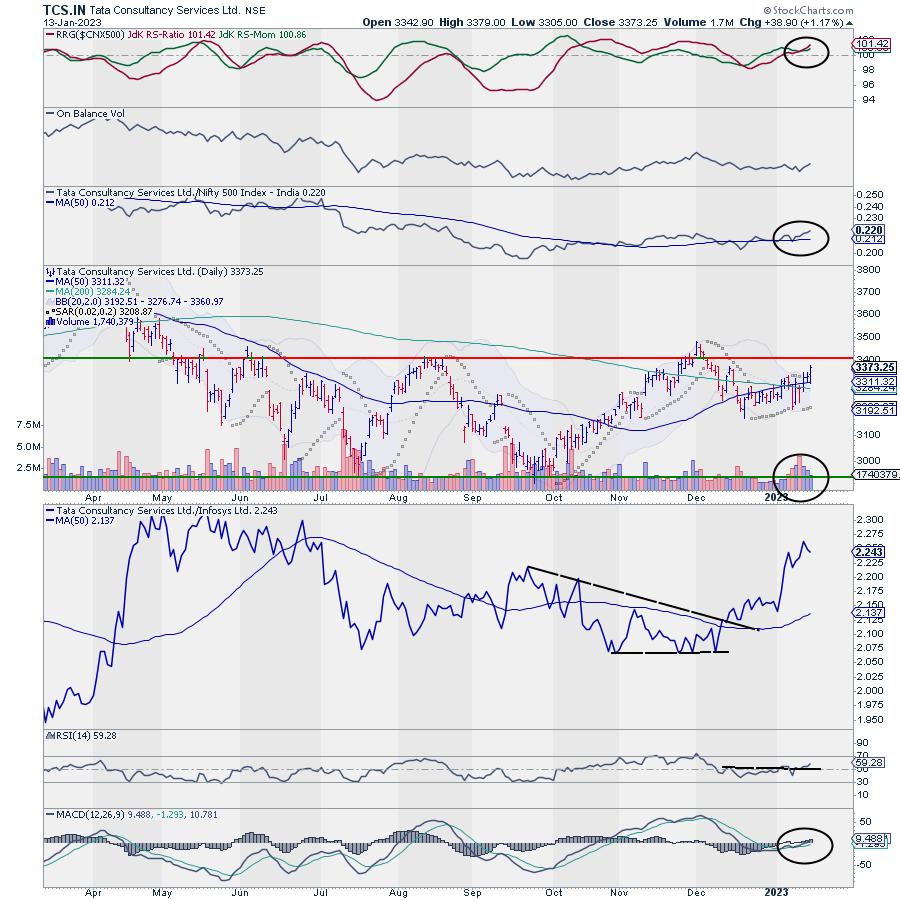
For most of 2022, TCS has underperformed the broader markets. It was only in October last year that the stock formed double-bottom support in the 2950-3000 zone and started to inch higher. The pattern analysis of the daily chart shows that between June last year and now, the stock has largely remained in a broad but well-defined trading range between 2950-3000 levels.
Following the up move that happened after the stock found double-bottom support near 3000 in October, the price tested the previous resistance near 3400 levels. After a failed attempted to break above this point, the prices retraced, but they ended up forming a significantly higher bottom on the chart.
Over the past three to four weeks, the stock has consolidated in a narrow range; consequently, the Bollinger bands narrowed indicating a period of low volatility in the stock. The recent price action shows a strong attempt by the stock to move higher. The price closed above the upper Bollinger band indicating a likely resumption of a meaningful up move. Even if the prices temporarily pull themselves back inside the band, a fresh initiation of an up move cannot be ruled out.
While the stock consolidated in a narrow range, it witnessed a Golden Cross as the 50-DMA crossed above the 200-DMA. The stock presently resides in the leading quadrant of the RRG when benchmarked against the broader NIFTY500 Index.
Importantly, the stock enjoys rising Relative Strength against the broader NIFTY500 Index. The RS line is rising above the 50-period MA. If we compare the stock against its peer INFOSYS (INFY.IN), TCS comes out as a better choice. The RS line of TCS against INFY too is in a strong uptrend and above the 50-period MA.
While MACD stays in continuing buy mode, PPO stays positive. The RSI has marked a fresh 14-period high which is bullish; it stays neutral and does not show any divergence against the price.
If the upward revision of price takes place on the expected lines, then the stock has the potential to test 3480-3500 levels. This translates into a price appreciation of ~4% from the current levels. Any close below 3170 will negate this technical setup.
and
Milan Vaishnav, CMT, MSTA | Consulting Technical Analyst | www.EquityResearch.asia | www.ChartWizard.ae
Disclosure pursuant to Clause 19 of SEBI (Research Analysts) Regulations 2014: The analyst, Family Members, or his Associates holds no financial interest below 1% or higher than 1% and has not received any compensation from the Companies discussed.
The securities discussed and opinions expressed in this report may not be suitable for all investors, who must make their own investment decisions, based on their own investment objectives, financial positions, and the needs of specific recipients. This may not be taken in substitution for the exercise of independent judgment by any recipient.
The recipient should independently evaluate the investment risks. The value and return on investment may vary because of changes in interest rates, foreign exchange rates, or any other reason. Past performance is not necessarily a guide to future performance. The usage of the Research Reports and other Services are governed as per the Terms of Service at https://equityresearch.asia/terms-of-use
The Research Analyst has not managed or co-managed the issues of any of the companies discussed and has not received any such remuneration from such activities from the companies discussed.
The Research Analyst has not received any remuneration from the Merchant Banking activities.
The Research Analyst has adopted an independent approach without any conflict from anyone. The Research Analyst has not received any compensation or other benefits from the companies mentioned in the report or third parties in connection with the preparation of the research report.
Compensation of the Research Analysts is not based on any specific merchant banking, investment banking, or brokerage service transactions.
The Research Analyst is not engaged in a market-making activity for the companies mentioned in the report.
The Research Analyst submits that no material disciplinary action has been taken on him by any Regulatory Authority impacting Equity Research Analysis activities.
This report is not directed or intended for distribution to, or use by, any person or entity who is a citizen or resident of or located in any locality, state, country, or other jurisdiction, where such distribution, publication, availability, or use would be contrary to law, regulation or which would subject the Research Analyst to any registration or licensing requirement within such jurisdiction.


